Skipping planning and strategizing can be a trader’s worst mistake. It can be a big mistake, especially when trading binary options. Binary options trading has a huge underlying risk. If your proposition fails, you lose your investment miserably.
Thus proper planning and binary options strategies are key elements for a successful trade.
While there are a lot of strategies, a trader should be mindful of the ones he uses for binary options. After all, the success of his decisions depends on these strategies.
Here, we will discuss 5 such strategies that one must use while trading binary options.
1. Support resistance strategy

Binary options trading involves great use of indicators. Indicators help a trader know the direction in which the market is moving. They also allow investors to pick the right time to buy and sell options.
Support resistance strategy is one such strategy that involves the use of various trading indicators. Using this strategy can lead you to the success of binary options trade. All online trading platforms, including Quotex, make available the indicators ideal for implementing this strategy.
To use this strategy, a trader must know the support and resistance levels in the market. Beginners might struggle to spot these. Well, this support resistance strategy guide will help you.
Our recommendation: Pick the best broker for binary trading!
Broker: | Review: | Advantages: | Sign up: |
1. Quotex |
| Live account from $ 10 (Risk warning: Your capital can be at risk) | |
2. IQ Option |
| Live account from $ 10 (Risk warning: Your capital can be at risk) | |
3. Pocket Option |
| Live account from $ 10 (Risk warning: Your capital can be at risk) |
What exactly are support and resistance?
Support and resistance are ideal for both short and long-term trading. Almost all traders win their binary options trade because they accurately identify the resistance and support levels.
| Good to know! |
| This strategy usually involves keeping a check on the asset’s price reaction. These reactions trigger because of the difference in buying and selling. |
It follows a simple economic theory:
- The price of underlying assets hikes in the presence of more buyers
- In the case of more sellers, the price of an underlying asset usually falls
In the support and resistance strategy, the support level means the point at which the buyers enter the market to buy and sell binary options.
| Good to know! |
| When an underlying asset’s price declines, it realizes a support level. The prices usually bounce back after the identification of the support level. However, there are situations when the price might break the level. In that case, it will decline further until the identification of other support levels. |
While the support level identifies as the point when the buyers enter the market, vice versa happens in the resistance level. The resistance level is when the sellers enter the market to sell binary options. The support level shows the floor and encourages a price rise.
On the other hand, the resistance level tells a trader about the ceiling price. It resists any price hikes.
(Risk warning: your capital can be at risk)
Using a support resistance strategy for binary options
You can use this strategy on all online trading platforms as you only need a few indicators. Brokers such as Quotex offer the users all the leading trading technical tools and indicators for analysis. It makes identifying the market trends and price changes easier for a trader.
To use this binary options strategy, a trader can
- Select a chart
- Identify the highs and lows
- Use the historical data
- Combine resistance and support levels with another trading strategy
- Let us explain the steps involved in this binary options strategy
#1 Select a chart
To trade binary options using the support resistance levels, you will have to pick any familiar chart. Your broker offers you various trading charts to conduct a thorough technical analysis.
#2 Identify the highs and lows

Once you have selected a chart, you can identify the highs and lows by drawing a line. It will help you determine the market trend. From this information, you can decipher whether the market is trending or not.
#3 Use the historical data
Apart from identifying the market highs and lows, you will also need historical data. It will help you know the price pattern of the asset you have picked for your binary options trade.
#4 Combine the resistance and support level with other trading strategies
A trader can use the present highs, lows, and historical data to know the resistance and support levels. Once done, he can use these with other trading strategies, such as moving averages. It will help him decide his future course of action for a binary options trade.
(Risk warning: your capital can be at risk)
2. Price action with candlesticks strategy
The candlesticks strategy is a widely used binary option winning strategy. Many traders trading on Quotex use this strategy to place winning trades. But, did you know you could use price action with candlesticks for a more fruitful result?
Let us tell you the relevance of price action with candlesticks.

What are candlesticks?
Candlesticks charts are like a trading indicator for the traders. It helps them determine the highs and lows and an asset’s opening and closing price.
Some benefits of using candlesticks for binary options trading include:
- They tell you about an asset’s highest and lowest price any day. The candlesticks allow you to compare this price with the opening and closing price.
- They are perfect for comprehending the impact of investors’ sentiment in the market. In other words, they are beneficial in helping you know when to enter or exit a trade.
- You can easily determine a bullish trend in the market when you see white or green candlesticks.
- The black or red color of the candle signals a bearish market. Accordingly, a trader can use this information to plan his binary options trade.
(Risk warning: your capital can be at risk)
What is price action?
Traders use price action to follow the movement of an asset’s price over time. Almost all binary options traders rely on price action to spot a favorable opportunity. It helps you undertake a technical analysis using an asset’s past price and various calculations.
| Good to know! |
| You can use the price action simply by using a chart with an asset’s price plotted for an extended time. It is like a data source that adds life to your trading strategies. |
Price action with candlestick charts
Knowing the price action basics is a powerful skill. A trader trading binary options should know how to look at candlestick charts. He should be able to determine the price action that made the candlestick chart appear like that.
Consider the following, for instance:
- You see a single candlestick with small shadows. These shadows appear on both the top and bottom.
- An experienced trader can determine that the closing price is higher than the opening price.
- In this case, the price action will form a low and trade higher than the low.
- Eventually, it will come back from the highs.
However, it might not be the whole picture while using this strategy. The whole situation might have happened because of other possibilities. While using price action with a candlestick, you might have to look for answers to why the candlestick looks like it does.
| Good to know! |
| A trader should also know the limitations of using this binary options strategy. You might lose if you keep your perspective limited to a single scenario. To save your investment, you should consider other factors affecting market reality. |
A binary options trader also needs to know about the lower time frame scenarios. Here is how the lower time frame helps while trading binary options trading.
- The traders will get a better grasp of the price action.
- You can determine the candlestick patterns for buying and selling binary options.
- Understanding this will help you filter the trades with low winning probabilities.
Thus, price action with candlesticks is one of the best binary options strategies. However, a trader must not skip researching the market while using this strategy. Ultimately, the result of your decision will depend on a variety of factors.
Our recommendation: Pick the best broker for binary trading!
Broker: | Review: | Advantages: | Sign up: |
1. Quotex |
| Live account from $ 10 (Risk warning: Your capital can be at risk) | |
2. IQ Option |
| Live account from $ 10 (Risk warning: Your capital can be at risk) | |
3. Pocket Option |
| Live account from $ 10 (Risk warning: Your capital can be at risk) |
3. RSI and Bollinger bands strategy for Binary Options
The RSI and Bollinger bands form one of the best binary options strategies. Using these trading indicators together can form a perfect binary options strategy for the traders.
Let us first know about these indicators individually.

Relative strength index
While trading binary options, a trader should be able to identify the momentum. Market warning signals and prevalent conditions also play a significant part in helping traders decide.
Some facts about the relative strength index are as follows:
- RSI depicts a value ranging between 0 and 100
- A score of 70 or more on the index signals an underbought asset
- When the value on RSI is 30 or less, it indicates an oversold asset
- The underbought signal on the RSI generally means that the short-term gains might mature soon
- The oversold signal, on the other hand, means that the short-term declines are maturing
Now that you know about RSI let us give you some information on the Bollinger bands.
Bollinger Bands
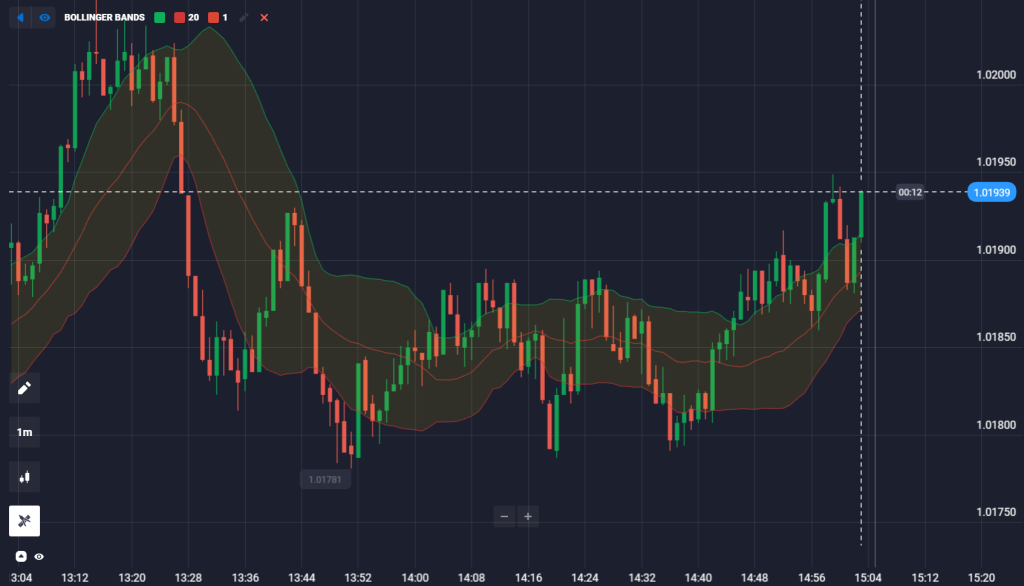
This trading indicator tells a trader about the range in which an asset trades. The information is usually available with the help of a band. That is why it is called Bollinger bands.
While using this indicator, you can use the following information:
- If the bands are closer or narrower, it generally means that the market is less volatile
- The wider bands signal a higher market volatility
Bollinger bands are beneficial for a trader to know when an underlying asset is trading outside its range.
- When the asset falls outside the band’s parameters, it signals an overbuying of the asset.
- An asset’s value falling under the ban’s parameters indicates the overselling of an asset.
(Risk warning: your capital can be at risk)
How does it work?
A trader trading binary options can combine RSI and Bollinger bands into one chart. He should study this chart to strategize his binary options trading. A trader can enter the market to buy binary options when:
- The asset price falls under the lower bands of the Bollinger bands.
- The relative strength index indicates an oversold signal with a value of 30 or less.
| Quick tip! |
| If you wish to use this strategy to sell your binary options, you can wait for the market to have overbought conditions. It happens when the relative strength index shows you a value of 70 or more. The Bollinger bands should also signal an overbought signal. It usually happens when the price exceeds the band’s upper parameters. |
The only trouble with the binary options strategy is that the market might show these signals for a long time. You might see the overbought/underbought conditions for weeks or months. It might confuse you when deciding whether it is the right time to buy or sell options.
Therefore, we always recommend combining certain factors before placing binary options trade. Implementing these strategies require high-end research on the investor’s end. Relying only on a few technical indicators might not yield the desired results.
(Risk warning: your capital can be at risk)
4. News trading strategy
The change in an asset’s price is due to macro-environmental factors. Many changes on the national and international levels affect an asset’s price. There is only one way to know about these changes: the news.
Changes that affect an asset’s price can be positive or negative. Thus, staying up to date with the news is crucial to tapping the opportunities.
Here are some reasons that explain the importance of staying informed:
- Economic changes taking place affect the asset’s price directly or indirectly
- The economic environment changes judge the market’s volatility
- These changes present earning opportunities for a trader
- News enhances your knowledge and makes you capable of diversifying your trades
- The significance of news makes it apparent why every trader should follow the news to trade binary options
Let us tell you how you can make news trading a part of your binary options strategy.
Using the news trading strategy:
A trader should concern himself with all kinds of financial news. Various events occur internationally, some of which are scheduled and others sporadic.
| Good to know! |
| Scheduled events are those that take place as per their schedule. For instance, the general elections take place at a scheduled time. On the other hand, sporadic events are those that take place unexpectedly. There is no logic behind the happening of these events, and their impact cannot get assessed right away. For instance, the pandemic outbreak was a sporadic event that affected the value of all assets, stocks, and commodities. |
Following the news regularly will help you plan your trading moves. The scheduled events give you a clearer picture of your financial decisions. For instance, if a government supporting more investment comes into power, you will likely buy more options.
However, predicting sporadic events is impossible. Therefore, a trader should always plan his trades, considering such possibilities. When you sense danger, you can use stop-loss options offered by the brokers. This trading feature is available on almost all modern online platforms, including Quotex.
| Quick tip! |
| Identify the best trading opportunities through the news. The following news is the best of all binary options trading strategies. |
(Risk warning: your capital can be at risk)
5. Candlestick Patterns strategy

Following the candlesticks, patterns can be the best binary option winning strategy. Candlestick, as one single bar, offers all the information a trader needs to know. All online trading platforms, including Quotex, provide the traders with candlestick charts.
These charts can give a trader relevant information about the price movements at any time. You can even change the time frame you wish to view the price.
Here are a few basics you should know about candlesticks:
- The green color of the candlesticks depicts an upward market trend, signaling a bullish market.
- The red candlesticks show a downward market trend. The red color indicates that the market is bearish.
- The candlesticks have a wick and a tail, one at the top and the other at the bottom. The upper wick indicated the highest asset price assumed over any given period.
- The lower part is the tail, which tells us the lowest price of an asset during the period in analysis.
A binary options trader can decipher the direction in which the market is moving by looking at a candlestick. Besides, he will also understand the following things:
- It becomes simple to know whether the movement was non-linear or linear. The presence of a wick or a tail usually signals a non-linear movement.
- The information about an asset’s opening or closing price becomes apparent.
- Data on an asset’s highest and lowest price during any given period becomes clear.
Now that you know the candlestick basics let us tell you about the candlestick patterns you can use while trading binary options.
Leading candlestick patterns
| Quick tip! |
| You can select a period for which you want the candlestick to show you information. It would offer you the most relevant information and help you strategize for binary options trading. |
Doji

This candlestick pattern has a small body. It usually indicates the same opening and closing level of the market.
Doji represents market indecision. It means that if you spot an increasing trend in the market, it might be about to change.
| Quick Tip! |
| You can use Bollinger bands with this candlestick pattern. If the price action falls outside the bands, it could signal that the trend might reverse. Therefore, it becomes clear whether to buy or sell your binary options. |
Our recommendation: Pick the best broker for binary trading!
Broker: | Review: | Advantages: | Sign up: |
1. Quotex |
| Live account from $ 10 (Risk warning: Your capital can be at risk) | |
2. IQ Option |
| Live account from $ 10 (Risk warning: Your capital can be at risk) | |
3. Pocket Option |
| Live account from $ 10 (Risk warning: Your capital can be at risk) |
Dragonfly and gravestone Dojis

When the high, open, and closing prices are the same, it gets represented by the Dragonfly Doji. Since all three are identical, you will see a T shape in this candlestick pattern. It also indicates a trend reversal where a candlestick showing an increasing trend might reverse soon.
This binary options trading strategy helps traders decide when to enter or exit a trade. For example, if you expect a bullish trend, you might want to enter a trade.
Hammer

Some candlestick patterns are hammer-shaped. They have long tails. Traders usually see this pattern when the market falls or has a downward trend.
The hammer indicates that the selling pressure is about to halt, and the buyers might step in to take over. When you see this pattern, you can consider it a good time to buy binary options.
Hanging man
The hanging man is another candlesticks pattern that uses the same concept as the hammer. It has the same look as that of a hammer. However, you will see this pattern when there is a positive change in the market.
A very long wick and small body are indicators of the hanging man.
Bet hold

When you see this candlestick pattern, it indicates that the investor sentiments can change. They will show you a trend in one direction clearly.
Bet hold indicators tell you that the trends are about to reverse. So, you can plan your next options trade accordingly.
Thus, candlesticks can be your escape if you are losing consecutive binary options trade. These patterns can help you know the market changes and suggest the most accurate time for trading.
(Risk warning: your capital can be at risk)
What is the best strategy for Binary Options?
Having read about all the binary options winning strategies, one might wonder which one is the best.
Frankly, no binary options trading strategy can bring you success unless you do your homework. It includes good research work and thorough technical analysis. These binary options trading strategies might not guarantee you success. Nevertheless, they offer you a roadmap to success while trading binary options.
Here are a few ways you can use to ensure your success while trading binary options:
- Use more trading indicators and conduct a well-founded technical analysis.
- Include the usage of trading charts and other tools that manifold your chances of earning profits.
- Combine trading strategies with various tools and indicators.
- Avoid the urge to overtrade when you make losses and try to keep your emotions in control.
- Follow the news for the latest update on the factors that could affect the price of an asset.
Conclusion
Binary options trading is risky, but traders can use the most accurate trading strategies to manage this risk. A trader can use any trading strategy, but these strategies might help the trader increase his chances of earning profits.
Most advanced traders trading on Quotex and other platforms use these strategies to reap high profits. Using candlesticks with other indicators like Bollinger bands, RSI, etc., might deliver accurate results.
However, a trader should refrain from depending on these indicators solely. Many other factors cause the market to change, and a trader must keep these in mind.
(Risk warning: your capital can be at risk)